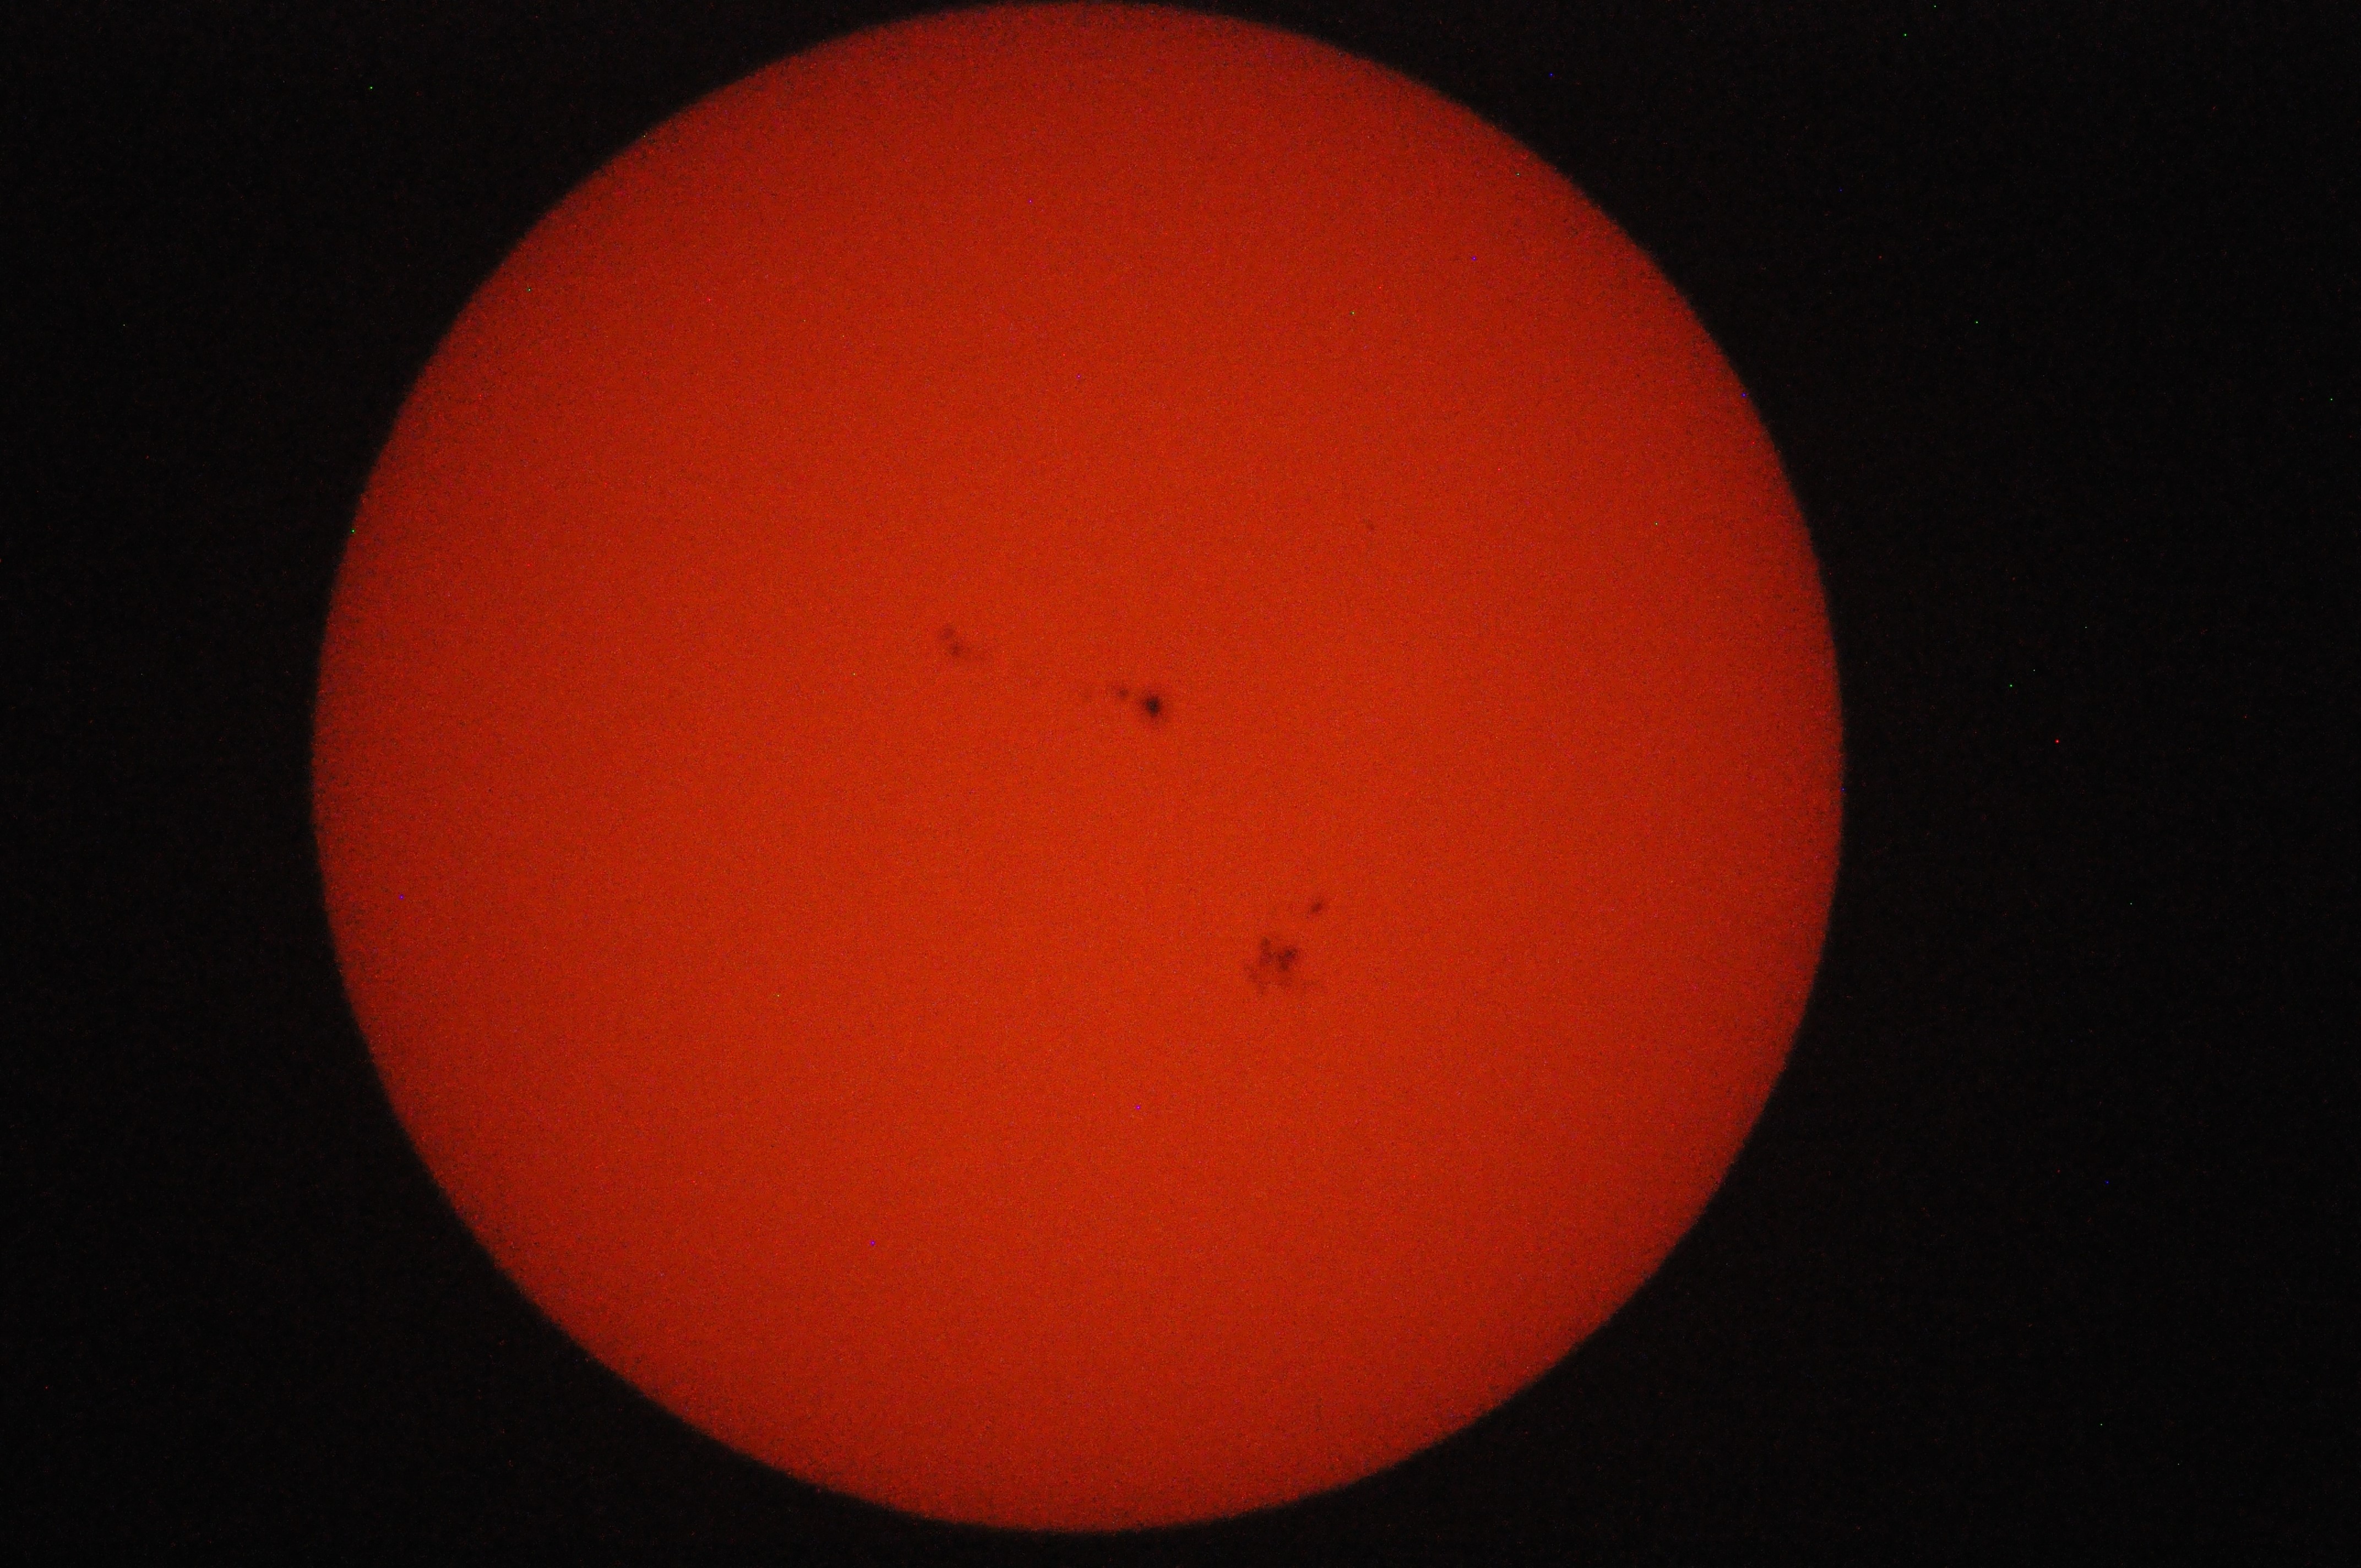
100 Days of Code – Day 4

Today I successfully created a pandas DataFrame in rtlamrvis.py containing the rtlamr data, and created line plots for individual meter IDs. Scatter plots aren’t working, but a line still shows what’s going on. Below are a few sample plots, including two of data I previously hypothesized is from a power meter on a building with solar panels.

Partial day’s data from what I believe is a power meter on a building with solar panels
Another power meter with solar panels; the peaks happen at around 10:00 AM each day
This is probably a gas meter, judging by the on-off cycles

I’m really pleased that I finally had some success plotting the rtlamr data. It took a long time to find a pandas plotting example that I could understand. Most of the examples I found were either obviously not written for a beginner in mind, or assumed the reader would be using Jupyter notebooks. My code was executing without errors but I still wasn’t seeing any plots…until I found that magic incantation:

matplotlib.pyplot.show()

Next steps:

  • Figure out how to plot multiple data sets on the same axes
  • Calculate and plot the rate of consumption instead of the consumption counter value
  • Get scatter plots working

100 Days of Code – Day 3

Today I wanted to start experimenting with plotting data with Python, and began investigating the pandas library. I looked at a few tutorials, but quickly realized this wasn’t going to be a get-it-up-and-running-in-10-minutes thing, at least at my current skill level. I definitely have more reading to do on this topic.

Since I wasn’t ready to plot anything, and wasn’t sure what I wanted to work on next in rtlamrvis, I decided to work through a few Python tutorials. I’m going to start splitting my hour of code between tutorials and projects, until I have a better handle on the basics of Python. I think that will make my coding sessions more productive and less frustrating.

After working on tutorials for a while, I decided to look at rtlamrvis again, and changed the way it’s organizing the data from rtlamr. Instead of the list-of-dictionaries structure, I now have a dictionary-of-lists-of-dictionaries structure. Despite sounding more complicated, I think it will make it easier when it comes time to plot the data, since it will be grouped by ID rather than by date. Maybe there’s a way to do this all in a pandas dataframe, but I’m not at that level yet.

I used pprint, part of the standard library, to verify that the code was doing what I wanted. Here’s an example of the output, which shows the new data structure. (Note: I always change the IDs before I publicly post any of the output, since I’m running my script against real data received from utility meters in my neighborhood.)

{25130001: [{'Consumption': 1692966, 'Time': '2019-01-31T14:37:59.535801779-08:00'},
{'Consumption': 1692966, 'Time': '2019-01-31T14:39:01.912742779-08:00'},
{'Consumption': 1692966, 'Time': '2019-01-31T14:39:02.275644411-08:00'},
{'Consumption': 1692966, 'Time': '2019-01-31T14:40:02.637966157-08:00'},
{'Consumption': 1692966, 'Time': '2019-01-31T14:40:02.984066933-08:00'},
{'Consumption': 1692966, 'Time': '2019-01-31T14:44:08.92041054-08:00'},
{'Consumption': 1692966, 'Time': '2019-01-31T14:45:07.802489288-08:00'},
{'Consumption': 1692966, 'Time': '2019-01-31T14:45:08.149153195-08:00'}],
25130002: [{'Consumption': 1268989, 'Time': '2019-01-31T14:37:59.651609372-08:00'},
{'Consumption': 1268996, 'Time': '2019-01-31T14:39:02.027027329-08:00'},
{'Consumption': 1268996, 'Time': '2019-01-31T14:39:02.398141433-08:00'},
{'Consumption': 1269003, 'Time': '2019-01-31T14:40:02.753874744-08:00'},
{'Consumption': 1269003, 'Time': '2019-01-31T14:40:03.135628029-08:00'},
{'Consumption': 1269027, 'Time': '2019-01-31T14:44:08.69528619-08:00'},
{'Consumption': 1269027, 'Time': '2019-01-31T14:44:09.036069368-08:00'},
{'Consumption': 1269032, 'Time': '2019-01-31T14:45:07.918476317-08:00'},
{'Consumption': 1269032, 'Time': '2019-01-31T14:45:08.307969063-08:00'}],
25130003: [{'Consumption': 423976, 'Time': '2019-01-31T14:37:59.472225052-08:00'},
{'Consumption': 423976, 'Time': '2019-01-31T14:37:59.800811534-08:00'},
{'Consumption': 423970, 'Time': '2019-01-31T14:39:02.157949477-08:00'},
{'Consumption': 423970, 'Time': '2019-01-31T14:39:02.52558898-08:00'},
{'Consumption': 423963, 'Time': '2019-01-31T14:40:03.251006466-08:00'},
{'Consumption': 423939, 'Time': '2019-01-31T14:44:09.187101414-08:00'},
{'Consumption': 423934, 'Time': '2019-01-31T14:45:08.033166217-08:00'},
{'Consumption': 423934, 'Time': '2019-01-31T14:45:08.416413207-08:00'}],
25790004: [{'Consumption': 250917, 'Time': '2019-01-31T14:38:41.19477672-08:00'}],
32780005: [{'Consumption': 365170, 'Time': '2019-01-31T14:40:27.925069332-08:00'},
{'Consumption': 365170, 'Time': '2019-01-31T14:46:23.433415367-08:00'},
{'Consumption': 365170, 'Time': '2019-01-31T14:48:23.422122806-08:00'}],
33560006: [{'Consumption': 169636, 'Time': '2019-01-31T14:42:46.470004195-08:00'},
{'Consumption': 169636, 'Time': '2019-01-31T14:44:46.970037449-08:00'}],
34330007: [{'Consumption': 452616, 'Time': '2019-01-31T14:45:09.642549085-08:00'}],
34330008: [{'Consumption': 110476, 'Time': '2019-01-31T14:39:43.206066618-08:00'},
{'Consumption': 110476, 'Time': '2019-01-31T14:41:45.70258951-08:00'},
{'Consumption': 110476, 'Time': '2019-01-31T14:43:44.22001873-08:00'},
{'Consumption': 110476, 'Time': '2019-01-31T14:45:41.200623187-08:00'},
{'Consumption': 110478, 'Time': '2019-01-31T14:49:41.202099703-08:00'}],
35060009: [{'Consumption': 339538, 'Time': '2019-01-31T14:38:57.983626969-08:00'},
{'Consumption': 339538, 'Time': '2019-01-31T14:47:00.485356661-08:00'}],
41930010: [{'Consumption': 419058, 'Time': '2019-01-31T14:44:48.43359395-08:00'},
{'Consumption': 419058, 'Time': '2019-01-31T14:45:49.434384863-08:00'},
{'Consumption': 419058, 'Time': '2019-01-31T14:49:49.41852109-08:00'}],
47570011: [{'Consumption': 275208, 'Time': '2019-01-31T14:40:05.089249374-08:00'},
{'Consumption': 275208, 'Time': '2019-01-31T14:42:05.604592569-08:00'},
{'Consumption': 275208, 'Time': '2019-01-31T14:47:05.086830549-08:00'},
{'Consumption': 275208, 'Time': '2019-01-31T14:49:05.085712251-08:00'},
{'Consumption': 275208, 'Time': '2019-01-31T14:50:05.58677753-08:00'}],
47580012: [{'Consumption': 150236, 'Time': '2019-01-31T14:39:51.690447444-08:00'},
{'Consumption': 150236, 'Time': '2019-01-31T14:42:51.189222909-08:00'}],
49570013: [{'Consumption': 67188, 'Time': '2019-01-31T14:40:01.321136185-08:00'}]}

The data appears the way I expect, and it’s much easier to read now than in the original format from rtlamr. This is the output for 50 lines of input data. With more lines, you can start to see some interesting trends. For example, ID 25130003 shows a decreasing Consumption value, while the rest show an increasing value. When I look at a larger dataset, I can see that number fluctuate up and down. This would make no sense for a gas or water meter, so my guess is that 25130003 is a power meter and the owner has solar panels (sometimes they’re generating more power than they’re consuming). It’s a curiosity, but I’m not going to go around snooping at all my neighbors’ meters to solve the mystery. The point of this project is to help me identify my own meter, not invade others’ privacy.

100 Days of Code – Day 2

After finding and fixing the dictionary problem last night, I’m feeling less defeated. This evening I finished the JSON parsing code. It’s not a lot to show for an hour’s work, but at least it’s progress.

{"Time":"2019-01-30T21:40:45.332439321-08:00","Offset":0,"Length":0,"Message":{"ID":12345678,"Type":7,"TamperPhy":2,"TamperEnc":0,"Consumption":1758381,"ChecksumVal":11007}}
{"Time":"2019-01-30T21:55:32.567053829-08:00","Offset":0,"Length":0,"Message":{"FrameSync":5795,"ProtocolID":30,"EndpointType":156,"EndpointID":98765432,"Consumption":209856,"Tamper":3080,"PacketCRC":62927}}

Looking at the sample rtlamr output above, we can see two distinct formats for meter reports. They both contain Consumption fields, but one has some extra protocol-related fields and uses different names for a few of the fields, the most notable being EndpointID instead of ID. In these cases I’m creating a new ID key and assigning it the value of the EndpointID key.

Next, I’m flattening the data structure so that there’s no longer a nested Message dictionary. Because I’m only concerned with the Time, ID, and Consumption keys, I’m copying the ID and Consumption keys to the outermost dictionary, and then deleting the Message key. I’m also deleting the Offset and Length keys since I don’t have a use for them (and they seem to always have a value of zero anyway). What I’m left with is a dictionary containing only the three keys I need. I then append the dictionary to a list.

I think my next step is to start reading up on the various Python visualization libraries, and deciding which one is a good fit for what I want to accomplish in this project.

100 Days of Code – Day 1

I spent entirely too much time today setting up my development environment on my Windows laptop. All the tools installed fine, but there were a lot of post-install configuration problems with Git Bash and ssh. Eventually I got everything – Python, pip, pipenv/virtualenv, git, and VSCode – installed and working, but it was a frustrating experience.

I’m very new to Python, and it turns out I’m more lacking in the fundamentals than I thought. I started working on the data ingestion code for my rtlamr data visualization project (which I’ll refer to as rtlamrvis from now on). I’m so new to Python, in fact, that I forgot how some simple things work, such as reading from a file, and had to look up some code examples. I coded for over an hour, but it felt like a good chunk of that time was spent looking at documentation.

Previous to Python, all my recent coding was in Perl. Not knowing enough of the basics of Python means that I keep trying to work with and think about data structures the way I would in Perl. The data I’m trying to read from rtlamr is in JSON format, and each line contains a nested dictionary. Here are a few sample lines:

 
{"Time":"2019-01-30T21:02:00.39401341-08:00","Offset":0,"Length":0,"Message":{"ID":12345678,"Type":12,"TamperPhy":3,"TamperEnc":0,"Consumption":364968,"ChecksumVal":63704}}
{"Time":"2019-01-30T21:18:35.642387991-08:00","Offset":0,"Length":0,"Message":{"FrameSync":5795,"ProtocolID":30,"EndpointType":156,"EndpointID":23456789,"Consumption":128898,"Tamper":2568,"PacketCRC":959}}
{"Time":"2019-01-30T21:28:21.728291686-08:00","Offset":0,"Length":0,"Message":{"FrameSync":5795,"ProtocolID":30,"EndpointType":156,"EndpointID":34567890,"Consumption":209850,"Tamper":3080,"PacketCRC":59910}}
{"Time":"2019-01-30T21:32:22.551431986-08:00","Offset":0,"Length":0,"Message":{"FrameSync":5795,"ProtocolID":30,"EndpointType":156,"EndpointID":45678901,"Consumption":128902,"Tamper":2568,"PacketCRC":57215}}
{"Time":"2019-01-30T21:38:51.098216075-08:00","Offset":0,"Length":0,"Message":{"ID":56789012,"Type":12,"TamperPhy":1,"TamperEnc":0,"Consumption":339342,"ChecksumVal":21221}}

Looking at my commit from earlier today doesn’t reveal what I had been doing wrong. I had changed so much while trying to figure out how to access the nested elements of the dictionary, I ended up removing all my original code that was throwing syntax errors. After a break from staring at the code, and some dinner, I made another attempt at it, and this time got it to work. I think one of my problems previously was that I was trying to use curly braces instead of square brackets:

import json

rtlamr_file = "testdata/test.json"

rtlamr_data = []
with open(file=rtlamr_file) as rtlamr_f:
for line in rtlamr_f:
line_json = json.loads(line)

# this works
if 'ID' in line_json['Message']:
print('Found ID')
elif 'EndpointID' in line_json['Message']:
print('Found EndpointID')

# this does NOT work
if 'ID' in line_json{'Message'}:
print('Found ID')
elif 'EndpointID' in line_json{'Message'}:
print('Found EndpointID')


The moral of the story: Python is not Perl. Also, it’s late and I must sleep…hopefully this blog post will still make some sense in the morning.

100 Days of Code

I’m working on learning Python, and improving my coding skills in general, and have decided to take the #100DaysOfCode challenge. The official challenge website explains it all but, in a nutshell, I’m making a commitment to code for at least an hour every day, for 100 days, on my own projects outside of work. I will be posting updates on twitter, on GitHub, and on this blog. I have a couple ideas for projects to start out with, and just need to decide on a list of features I want to implement before I get started coding.

The first project I have in mind will be a tool to visualize natural gas consumption data gathered through the rtlamr tool. In addition to the gas meter data, my visualization tool will also graph the furnace thermostat on/off state data received from my home automation system via an MQTT broker. The goal is to see if I can correlate the furnace usage with any of the gas meter data received by rtlamr – I’m not seeing my gas meter’s serial number in the data and I think it may actually have a different serial number than what’s printed on the transmitter’s label. Rtlamr can output in JSON, so parsing the data won’t be challenging. I have little experience with the paho-mqtt library, however, and have never worked with any of the Python graphing libraries. I expect I’ll learn quite a bit from this first project.

Star Trails

Star trails over the Sunriver Resort

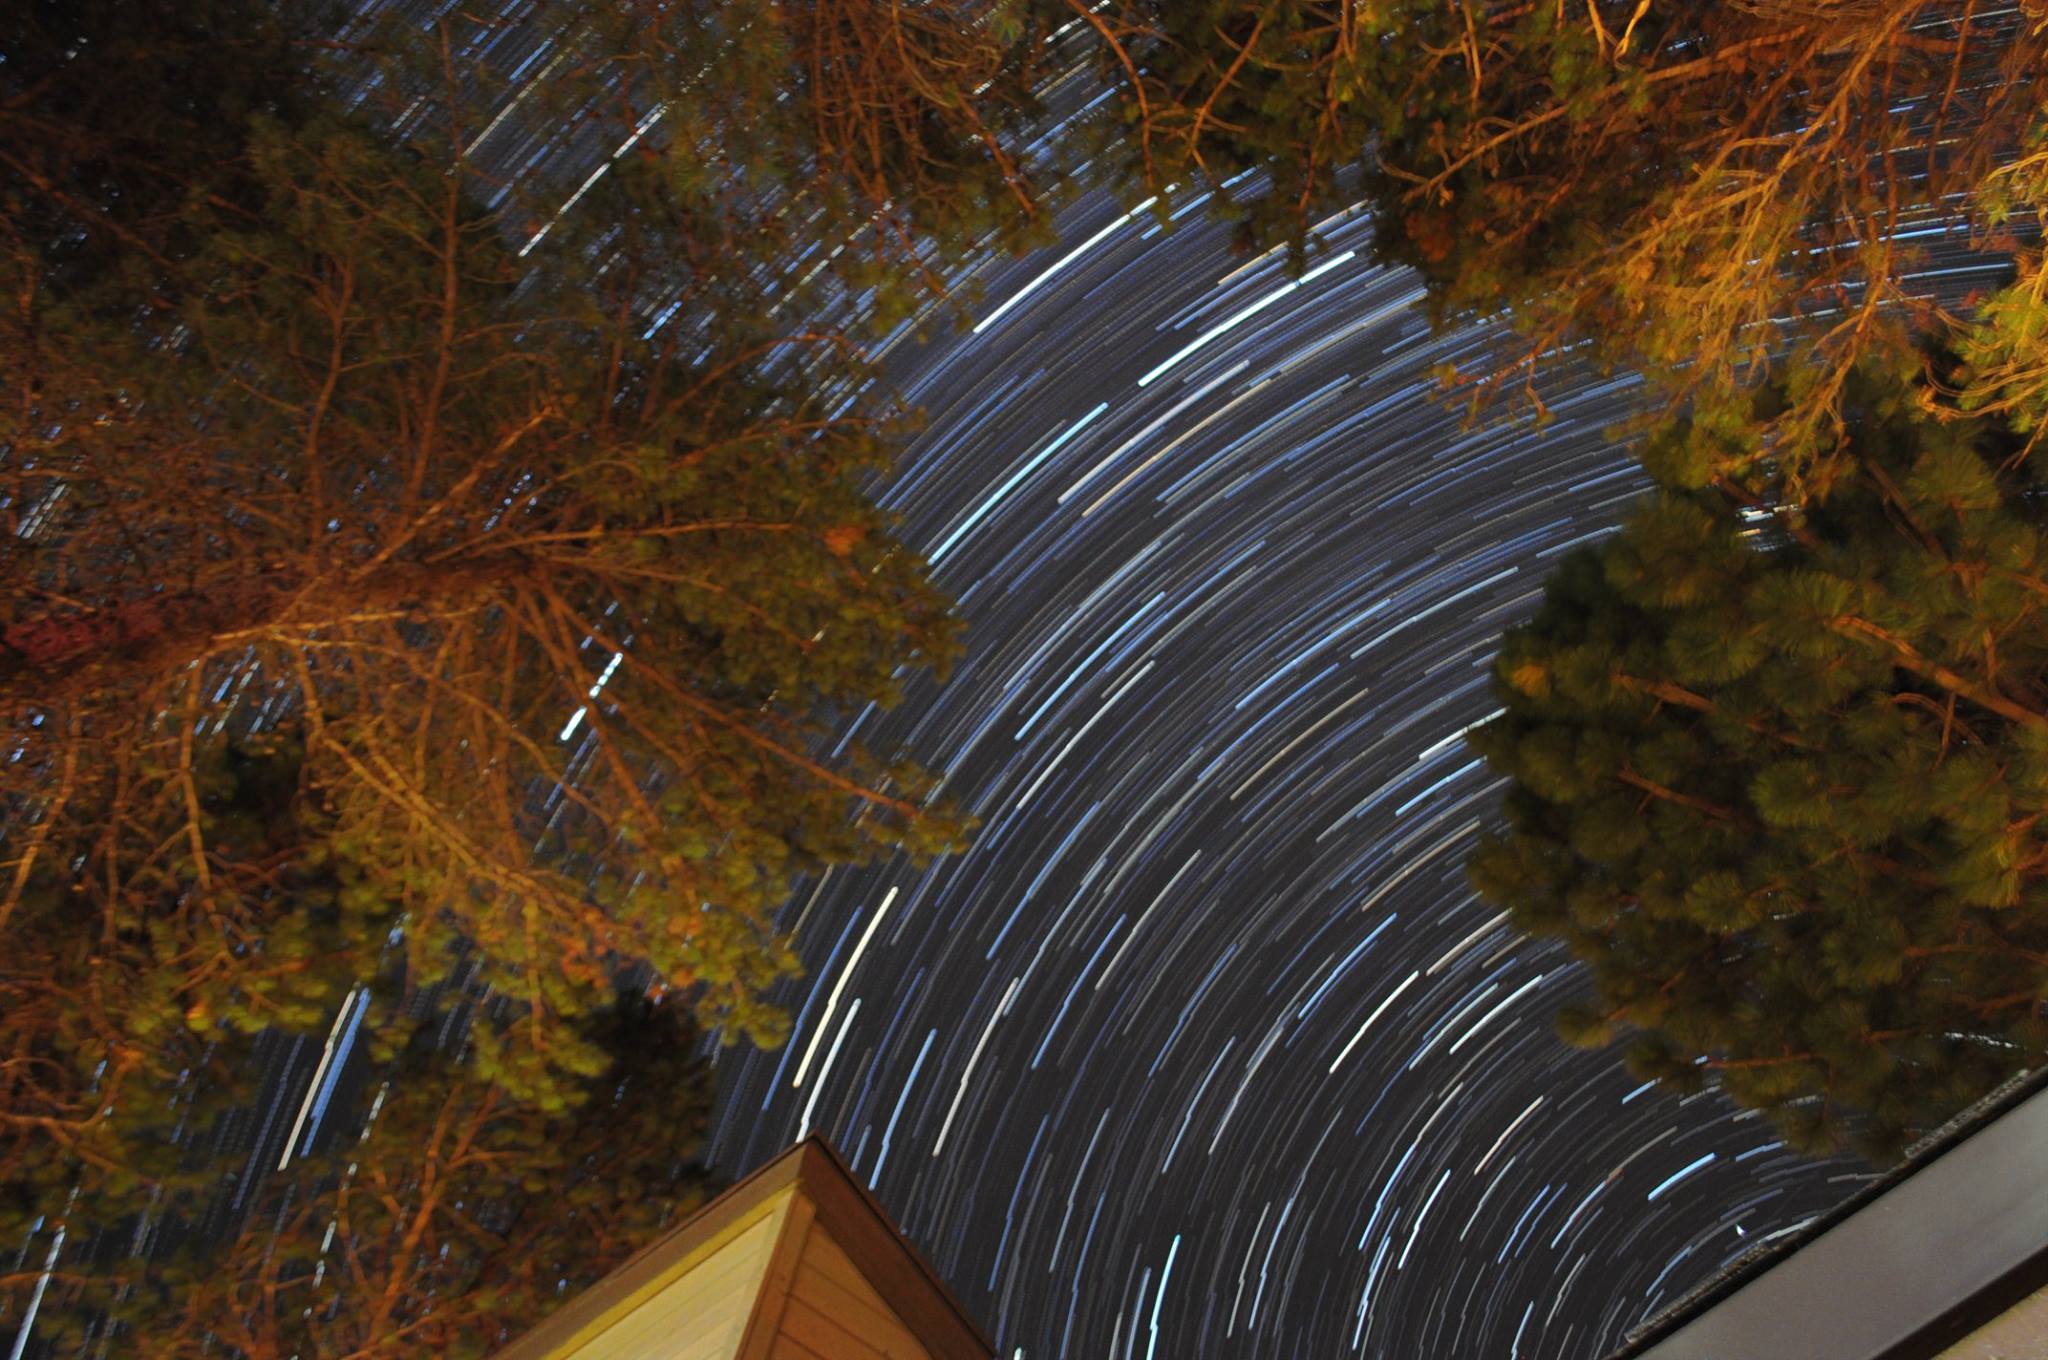
This is my first attempt at star trail photography. The photo was produced by stacking 48 one-minute exposures. It was a bit out of focus, I accidentally set the white balance on automatic, and I managed to bump the tripod partway through, but I still think it turned out well for a first attempt.

I also made a short time-lapse video from the photos used to create the star trail composite above. Shorter exposures (and more of them) would have made it smoother, but I still enjoy watching it.

Partial Solar Eclipse with Sunspots

I’m glad I decided to work from home today, and that the clouds cleared for a while. It meant that I got to view the partial solar eclipse, and I even managed to take a few pictures!

Partial solar eclipse with sunspots 2192, 2193, and 2194

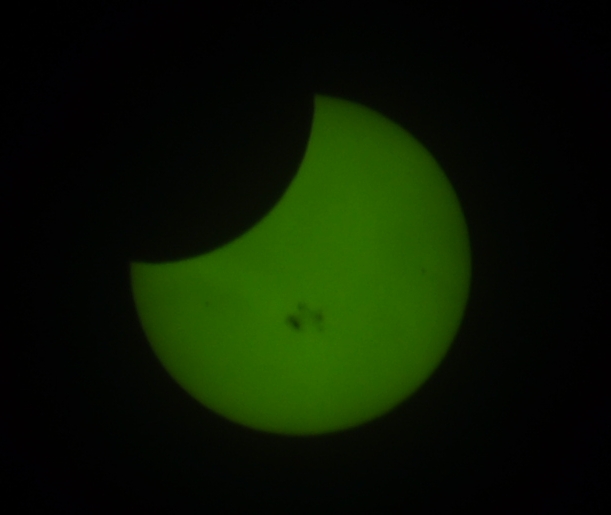
The picture above is a bit blurry, but you can clearly see the moon’s shadow, and even sunspots 2192 (the big cluster in the middle), 2193 (the tiny dark spot on the right), and 2194 (the tiny dark spot on the left). The sunspots aren’t remotely as clear as those same spots in this image on Spaceweather.com, but you can see their likeness.

The photo was taken with a Nikon D5000 DSLR, a Nikon 200mm lens, and a cheap welding helmet as the filter. I took several pictures but this was the least blurry. That lens is really difficult to focus sharply on something 93 million miles away.